SDLT Receipts to July 2026: The Tax Take Rose, Stamp Duty on Homes Did Not
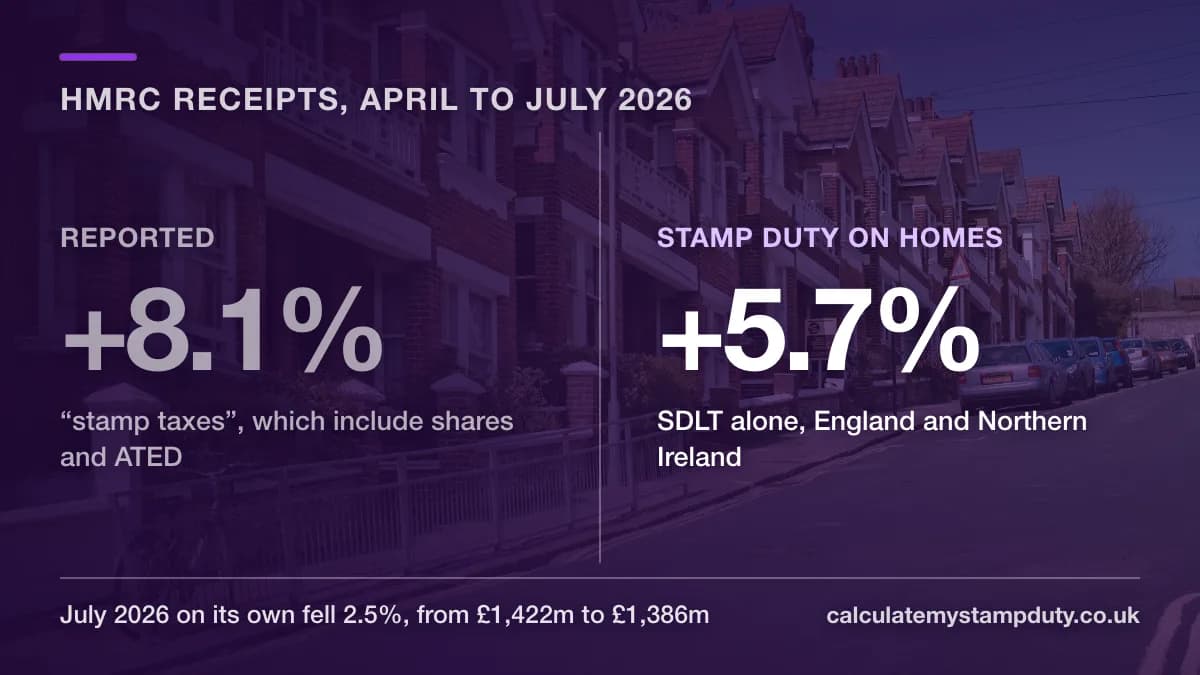
HMRC's 21 August release was reported as an 8% rise in stamp taxes. Separate out property from shares and the picture is different: SDLT is up 5.7% for the financial year to date, July itself fell, and the calendar year so far is flat to within £11m. Updated with the UK property transactions data HMRC published on 28 August.
Key Takeaways
- Update, 23 September 2026: HMRC's release of 22 September put August 2026 SDLT at £1,222m, down 7.0% on £1,314m in August 2025. April to August 2026 was £6,202m, up 2.9% on £6,027m
- HMRC published its monthly receipts bulletin on 21 August 2026, covering data to July 2026
- The widely reported figure was £6.9bn of stamp taxes for April to July 2026, up £0.5bn or about 8% on the same period last year
- That headline covers three separate taxes: SDLT on property, stamp duty on shares, and the Annual Tax on Enveloped Dwellings. It is not stamp duty on homes
- SDLT alone, which covers England and Northern Ireland only, was £4,980m for April to July 2026 against £4,713m a year earlier. That is a rise of £267m, or 5.7%
- July 2026 SDLT was £1,386m, down from £1,422m in July 2025. That is a fall of 2.5% and the first year-on-year decline since April
- Measured across the calendar year so far, January to July 2026 SDLT was £8,031m against £8,020m in 2025. That is a difference of £11m, or 0.1%, and effectively flat
- Stamp duty on shares rose £251m over April to July, up 16.1%, so roughly half the increase in the combined stamp taxes headline came from shares rather than property
- HMRC published transaction volumes separately on 28 August 2026. UK residential transactions in July 2026 were 96,710 seasonally adjusted, 1% lower than July 2025 and 2% lower than June, while the unadjusted count of 106,620 was 5% higher than July 2025
- The transactions series is UK-wide and includes Scottish and Welsh purchases, so it cannot be divided into the England and Northern Ireland receipts to produce an average tax per transaction
- Scotland and Wales are not included in any of these figures. They charge LBTT and LTT through their own revenue authorities
- Recent months are provisional and subject to revision in later releases
August Update: Receipts Fell 7%
Updated 23 September 2026.
HMRC published receipts to August 2026 on 22 September. SDLT for England and Northern Ireland was £1,222m in August, down from £1,314m in August 2025. That is a fall of £92m, or 7.0%, and the second year-on-year monthly fall in a row after July. It was also £164m lower than July 2026.
| SDLT, England and NI | 2025 (£m) | 2026 (£m) | Change |
|---|---|---|---|
| August | 1,314 | 1,222 | -7.0% |
| April to August (financial year) | 6,027 | 6,202 | +2.9% |
| January to August (calendar year) | 9,334 | 9,253 | -0.9% |
The financial year growth has more than halved in a month, from 5.7% to April to July to 2.9% to April to August. HMRC's own explanation for the stronger early months is the comparison base: “higher receipts in May 2026 to June 2026 compared to the year before can be attributed to reduced transaction levels in 2025 following transactions brought forward prior to Stamp Duty Land Tax rates changes in April 2025”. That effect has now worked through, and the bulletin gives no specific reason for August.
The same basis warning applies as last month. The bulletin's headline of £8.5bn of stamp taxes for April to August, up £0.4bn, includes stamp duty on shares and ATED. It is not the SDLT figure. All 2026 months are provisional.
The rest of this article covers the July release and is unchanged. HMRC's August property transactions figures are due on 30 September 2026. For what the Budget on 28 October could mean for these numbers, see Autumn Budget 2026 and stamp duty.
What HMRC Published
HMRC released its monthly tax receipts bulletin at 07:00 on 21 August 2026, adding July data. Total HMRC receipts for April to July 2026 were £322.7bn, £19.1bn higher than the same four months of 2025. Within that, the bulletin reported stamp taxes of £6.9bn, up £0.5bn on the year, which most coverage rendered as an 8% rise in stamp duty.
The 8% is arithmetically correct for the line HMRC labels “stamp taxes”. It is not the number that describes what buyers paid on homes, and the gap between the two is wide enough to change the conclusion.
Why the 8% Figure Is Not Stamp Duty on Homes
HMRC's monthly table carries three separate columns that are never summed in the underlying data but are combined in the bulletin commentary:
- Stamp Duty Land Tax, charged on property purchases in England and Northern Ireland.
- Stamp Duty Shares, which is stamp duty and Stamp Duty Reserve Tax on share transactions. Nothing to do with housing.
- Annual Tax on Enveloped Dwellings, an annual charge on residential property held in companies, which is small and heavily concentrated in April.
A further point is easy to lose. None of these figures include Scotland or Wales, which charge LBTT and LTT through Revenue Scotland and the Welsh Revenue Authority. There is no such thing as a single UK stamp duty receipts total, so any figure quoted should be labelled England and Northern Ireland.
Figures below are taken from the statistics table published alongside the bulletin rather than from the commentary, and are stated in £ millions on a cash basis.
SDLT Alone, Month by Month
Stripping out shares and ATED, this is SDLT on its own for the calendar year to date, against the same months of 2025 and 2024.
| Month | 2024 (£m) | 2025 (£m) | 2026 (£m) | 2026 v 2025 |
|---|---|---|---|---|
| January | 808 | 848 | 899 | +6.0% |
| February | 781 | 1,051 | 995 | -5.3% |
| March | 864 | 1,408 | 1,157 | -17.8% |
| April | 957 | 1,306 | 1,287 | -1.5% |
| May | 1,018 | 930 | 1,068 | +14.8% |
| June | 1,016 | 1,055 | 1,239 | +17.4% |
| July | 1,185 | 1,422 | 1,386 | -2.5% |
| January to July | 6,629 | 8,020 | 8,031 | +0.1% |
On the financial year basis HMRC uses, April to July 2026 SDLT was £4,980m against £4,713m in the same months of 2025, a rise of £267m or 5.7%. That is real growth, but it is not 8%, and it sits alongside a calendar year that has gone almost nowhere: £8,031m against £8,020m, a difference of £11m on a base of eight billion.
For context on the annual totals, SDLT finished 2025-26 at £15,159m, up 9.2% on the £13.9bn of 2024-25. The full receipts breakdown and four-nation split covers those years in more depth.
July Fell Year on Year
July 2026 SDLT was £1,386m against £1,422m in July 2025, a fall of £36m or 2.5%. It is the first year-on-year decline in a single month since April, and it follows two strongly positive months in May and June.
The swing is largely about the comparison base rather than a turn in the market. May and June 2025 were unusually weak because transactions had been pulled forward ahead of the April 2025 threshold changes, leaving the months immediately after them thin. That made May and June 2026 look strong against an easy base. July 2025, by contrast, was not weak. HMRC has attributed the strength from July to October 2025 to the thresholds coming down, which raises the tax collected per transaction and persists rather than unwinding. Comparing against that firmer base, July 2026 came in slightly lower.
A comparison to avoid
Part-year monthly averages should not be set against full-year averages. The first half of any recent year is structurally the weaker half, so doing this makes receipts look like they are falling when they are not. Compare the same months across years, as the table above does.
How Many Properties Changed Hands
Receipts measure money collected. They say nothing directly about how many properties were bought, and HMRC publishes that count in a different release. On 28 August 2026, a week after the receipts bulletin, it added July data to its monthly property transactions statistics.
| UK transactions, July 2026 (provisional) | Count | v July 2025 | v June 2026 |
|---|---|---|---|
| Residential, seasonally adjusted | 96,710 | 1% lower | 2% lower |
| Residential, non-seasonally adjusted | 106,620 | 5% higher | 3% higher |
| Non-residential, seasonally adjusted | 10,350 | 2% lower | marginally higher (less than 1%) |
| Non-residential, non-seasonally adjusted | 11,000 | 1% higher | 3% higher |
The two bases disagree on direction, which is why HMRC publishes both. Seasonally adjusted residential transactions fell from 98,390 in June 2026 to 96,710 in July, and HMRC presents that series to show the underlying trend once the normal shape of the year is stripped out. The unadjusted count, which is simply the number of completions recorded, rose 3% on June and was 5% above July 2025.
Two different maps, and why they cannot be divided
The transactions series covers the whole United Kingdom. HMRC compiles it from its own SDLT records together with LBTT records from Revenue Scotland and LTT records from the Welsh Revenue Authority. The receipts figures earlier in this article are SDLT only, which means England and Northern Ireland. Dividing one into the other to get an average stamp duty per transaction does not work, because Scottish and Welsh purchases would sit in the denominator while none of their tax appears in the numerator. Neither release publishes an average SDLT per transaction.
With the geography stated, the two series point the same way for the month itself. UK residential transactions were 1% lower than July 2025 on the seasonally adjusted basis, and England and Northern Ireland SDLT receipts were 2.5% lower than July 2025. Neither is a large move, and both are measured against a July 2025 that had not been hollowed out by the pull-forward earlier that year.
Across the financial year to date the two series separate. April to July 2026 UK residential transactions were 393,800 seasonally adjusted, against 342,900 in the same four months of 2025, a rise of 50,900 or 14.8%. England and Northern Ireland SDLT receipts rose 5.7% over the same window. Two mechanical points account for most of that gap before any reading of the market. First, the base: HMRC attributes the March 2025 peak in transactions, and the drop in April 2025, to completions brought forward ahead of the threshold reductions that took effect on 1 April 2025, so the four months being compared against are unusually thin in volume terms. Second, receipts lag completions. SDLT is due within 14 days of completion, so cash recorded in April 2025 still included tax on March 2025 completions, the largest month of the rush. Volumes recorded that drop immediately. Receipts did not.
HMRC attaches two cautions to this data that are worth carrying over. The latest month is provisional, compiled before all SDLT, LBTT and LTT returns have been received, and figures generally settle after about three months. And because the series counts completions, which HMRC notes come on average two to four months after an initial offer is made on a property, it does not necessarily represent the current strength of the market.
What This Says About the Market
Taken with those transaction volumes and the wider data released alongside the receipts, the picture is a market that is steady rather than either recovering or deteriorating sharply. The ONS bulletin of 19 August put average UK house prices at £272,000 in June 2026, with annual inflation slowing to 2.0%, the second consecutive monthly slowdown, and attributed the softer comparison to price growth having been stronger in the months after the April 2025 SDLT changes. London prices were down 2.5% over the year.
For SDLT, flat receipts across a calendar year in which thresholds have not moved implies transaction volumes and prices are broadly holding rather than growing. That matters ahead of the Autumn Budget on 28 October 2026, because reform arguments on both sides lean on receipts data. Proposals to reduce or replace stamp duty have been circulating through the summer, including a report on 19 August arguing that abolition could support around 300,000 additional home moves a year. We track the live proposals on our stamp duty reform page.
Nothing in this release changes any rate or threshold. Current SDLT rates remain as set in April 2025.
Annexe, land or an old home not sold yet?
These are the purchases where a standard calculator can get your stamp duty wrong. Get it checked before you exchange.
Frequently Asked Questions
How much stamp duty did HMRC collect in August 2026?
SDLT receipts were £1,222m in August 2026, covering England and Northern Ireland, down 7.0% from £1,314m in August 2025. April to August 2026 totalled £6,202m, up 2.9% on the same months of 2025. The figures are provisional.
How much stamp duty did HMRC collect in July 2026?
SDLT receipts were £1,386m in July 2026, covering England and Northern Ireland. That compares with £1,422m in July 2025, a fall of 2.5%. The figure is provisional and may be revised.
Why do some reports say £6.9bn and others a smaller number?
£6.9bn is the combined stamp taxes figure for April to July 2026, which includes stamp duty on shares and ATED alongside SDLT. SDLT on its own for those four months was £4,980m. Both are accurate, but they measure different things.
Do these figures include Scotland and Wales?
No. Scotland charges Land and Buildings Transaction Tax through Revenue Scotland, and Wales charges Land Transaction Tax through the Welsh Revenue Authority. HMRC's SDLT figures cover England and Northern Ireland only.
Are stamp duty receipts rising or falling in 2026?
On the financial year to date, April to July, SDLT is up 5.7%. Across the calendar year to date, January to July, it is up 0.1%, which is effectively flat. Which answer applies depends on the period being measured, which is why the basis should always be stated.
How many properties were bought in July 2026?
HMRC's provisional estimate, published on 28 August 2026, is 96,710 UK residential transactions on a seasonally adjusted basis and 106,620 unadjusted. Non-residential transactions were 10,350 seasonally adjusted and 11,000 unadjusted. That series is UK-wide and includes Scottish and Welsh purchases, so it does not share a geography with the England and Northern Ireland receipts in this article.
Can you work out the average stamp duty per property from these figures?
Not from these two releases. The receipts are SDLT for England and Northern Ireland, and the transaction counts are for the whole UK, so dividing one by the other would put Scottish and Welsh purchases in the denominator without their tax in the numerator. Neither release publishes an average per transaction.
When is the next release?
HMRC publishes the receipts bulletin monthly at 07:00. The August 2026 edition came out on 22 September, and the next will add September data in late October. The separate property transactions release is next due at 09:30 on 30 September 2026, covering August 2026.
Calculate Your Stamp Duty
Receipts data describes the total collected, not what any individual pays. For the tax due on a specific purchase at current rates, including the additional property surcharge and first-time buyer relief, use the calculator.
Use Stamp Duty CalculatorSources
- HMRC tax receipts and National Insurance contributions for the UK, released 21 August 2026, GOV.UK
- HMRC monthly receipts bulletin commentary, GOV.UK
- UK monthly property transactions commentary, released 28 August 2026, HMRC on GOV.UK
- Private rent and house prices, UK: August 2026, Office for National Statistics
- Scrapping stamp duty could unlock 300,000 home moves, says Rathbones, Mortgage Solutions, 19 August 2026
- Govt tax take climbs as stamp duty and IHT receipts increase, Mortgage Solutions, 21 August 2026
Monthly receipts figures are taken from the statistics table published alongside HMRC's bulletin and are cash receipts in £ millions covering England and Northern Ireland. Transaction counts come from HMRC's separate monthly property transactions release and cover the whole UK, including Scottish LBTT and Welsh LTT transactions. Recent months are provisional in both series. This article is not tax advice and is not affiliated with HMRC or GOV.UK.
Reviewed by

Julie White
ACAStamp duty specialist since 1999Stamp Duty Land Tax Specialist
ACA and Tax Adviser with a career spanning nearly four decades, specialising in stamp duty planning and advisory work since 1999.