Average Stamp Duty by Local Authority
What a home mover, a first-time buyer and an additional-property buyer would pay on the homes that actually sold in each of the 318 local authorities in England and Wales, August 2025 to July 2026. Built by running 656,217 HM Land Registry sales through our calculator.
Key Takeaways
- 31.3% of home sales in England now carry a stamp duty bill for a home mover that would have been £0 before April 2025.
- The average home mover's bill ranges from £156,670 in Kensington and Chelsea to £882 in City of Kingston upon Hull, about 178 times apart.
- First-time buyers get no relief on 18.2% of English sales, rising to 86.4% in Kensington and Chelsea and 65.4% in St Albans.
- In Wales, 53.1% of sales pay no Land Transaction Tax, against 7.1% of English sales paying no SDLT.
Headline figures
£300,000
Median sale price, England
£5,000
Median home mover bill, England
31.3%
English sales newly paying since April 2025
53.1%
Welsh sales paying no LTT
The average home mover bill in England is £10,707, well above the median of £5,000, because a small number of very expensive sales pull the average up. On the same homes a first-time buyer would pay £8,255 on average and an additional-property buyer £29,268. These are calculated bills, not HMRC receipts. See how we worked this out.
Where stamp duty is highest and lowest
Stamp duty is charged at the same rates across England, so the bill depends on local prices. The average home mover in Kensington and Chelsea would pay £156,670, while one in City of Kingston upon Hull would pay £882.
| Local authority | Median price | Average mover bill |
|---|---|---|
| Kensington and Chelsea | £1,050,000 | £156,670 |
| City of Westminster | £805,000 | £112,790 |
| Camden | £750,000 | £75,738 |
| Hammersmith and Fulham | £675,000 | £50,822 |
| Richmond upon Thames | £710,000 | £48,463 |
| Elmbridge | £657,500 | £47,749 |
| Islington | £645,000 | £42,536 |
| Wandsworth | £635,000 | £39,906 |
| Merton | £540,000 | £35,663 |
| Barnet | £590,000 | £35,096 |
| Local authority | Median price | Average mover bill |
|---|---|---|
| City of Kingston upon Hull | £140,000 | £882 |
| Blackpool | £140,000 | £963 |
| Hyndburn | £145,000 | £1,219 |
| Stoke-on-Trent | £160,000 | £1,469 |
| Burnley | £140,000 | £1,486 |
| Middlesbrough | £160,000 | £1,666 |
| Sunderland | £153,000 | £1,755 |
| Redcar and Cleveland | £165,500 | £1,802 |
| North East Lincolnshire | £160,000 | £1,823 |
| County Durham | £144,000 | £1,902 |
Rankings include areas with at least 300 sales in the period.
Annexe, land or an old home not sold yet?
These are the purchases where a standard calculator can get your stamp duty wrong. Get it checked before you exchange.
Sales newly paying stamp duty since April 2025
On 1 April 2025 the nil-rate band for home movers in England fell from £250,000 to £125,000. A sale between those two figures used to carry no stamp duty for a home mover and now carries up to £2,500. That band is where much of the Midlands and the North trades, so the change landed unevenly: 63.8% of sales in City of Nottingham fall in it, against 31.3% across England.
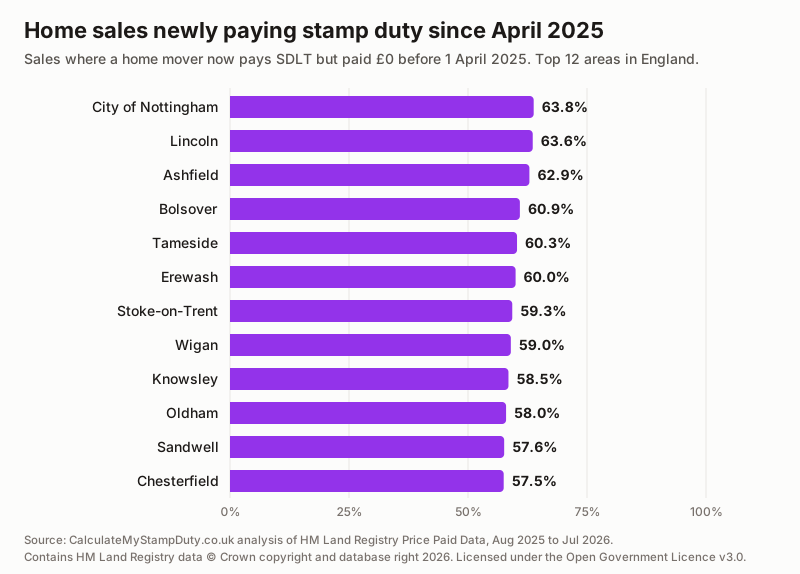
| Local authority | Median price | Newly paying |
|---|---|---|
| City of Nottingham | £200,000 | 63.8% |
| Lincoln | £190,000 | 63.6% |
| Ashfield | £195,000 | 62.9% |
| Bolsover | £180,000 | 60.9% |
| Tameside | £218,000 | 60.3% |
| Erewash | £220,000 | 60.0% |
| Stoke-on-Trent | £160,000 | 59.3% |
| Wigan | £200,000 | 59.0% |
| Knowsley | £195,000 | 58.5% |
| Oldham | £215,000 | 58.0% |
Want the bill on a specific price under both sets of rules? The April 2025 changes, one year on walks through it.
Where first-time buyer relief runs out
First-time buyers in England pay nothing up to £300,000 and 5% on the part from £300,001 to £500,000. Above £500,000 the relief is withdrawn entirely and they pay standard rates. Across England, 51.2% of sales are at £300,000 or less, so a first-time buyer would pay nothing on them. In much of London and the commuter belt the picture is reversed.
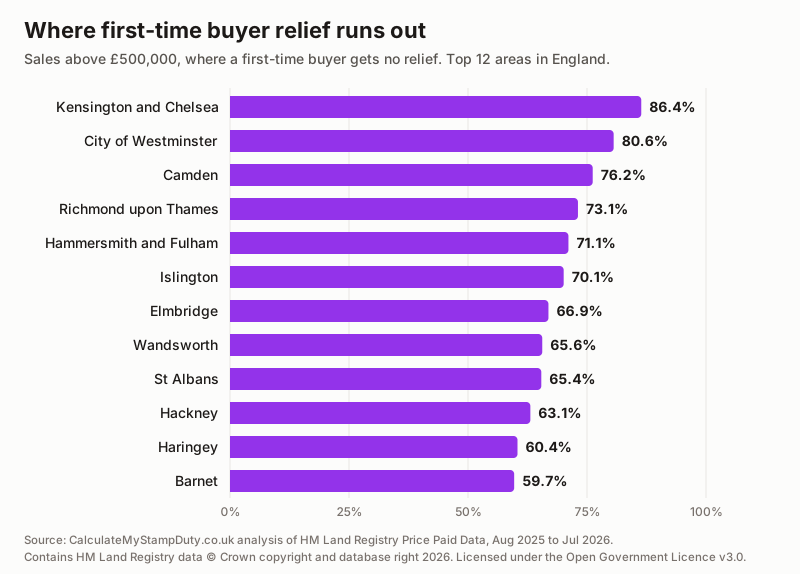
| Local authority | Median price | No FTB relief |
|---|---|---|
| Kensington and Chelsea | £1,050,000 | 86.4% |
| City of Westminster | £805,000 | 80.6% |
| Camden | £750,000 | 76.2% |
| Richmond upon Thames | £710,000 | 73.1% |
| Hammersmith and Fulham | £675,000 | 71.1% |
| Islington | £645,000 | 70.1% |
| Elmbridge | £657,500 | 66.9% |
| Wandsworth | £635,000 | 65.6% |
| St Albans | £620,000 | 65.4% |
| Hackney | £589,950 | 63.1% |
Check your own position with the first-time buyer stamp duty calculator.
Wales: Land Transaction Tax by area
Wales charges Land Transaction Tax, not SDLT. Its nil-rate band is £225,000 for anyone not paying the higher rates, and there is no first-time buyer relief, so a cheaper sale is far more likely to pay nothing. 53.1% of Welsh sales paid no LTT, rising to 81.0% in Blaenau Gwent. The highest average bill is in The Vale of Glamorgan at £9,766.
| Local authority | Median price | Average bill |
|---|---|---|
| The Vale of Glamorgan | £290,000 | £9,766 |
| Monmouthshire | £325,000 | £9,453 |
| Cardiff | £270,000 | £7,417 |
| Powys | £250,000 | £4,874 |
| Isle of Anglesey | £230,000 | £4,458 |
| Local authority | Median price | Pay nothing |
|---|---|---|
| Blaenau Gwent | £142,000 | 81.0% |
| Merthyr Tydfil | £145,000 | 79.6% |
| Neath Port Talbot | £165,000 | 76.6% |
| Rhondda Cynon Taff | £163,000 | 72.8% |
| Torfaen | £196,000 | 62.1% |
Work out a Welsh bill with the Wales LTT calculator.
Every local authority in England and Wales
Search for your council or sort by any column. All figures are for sales from August 2025 to July 2026.
Showing 318 of 318 areas. Select a column heading to sort.
| Kensington and Chelsea | 1,225 | £1,050,000 | £48,750 | £156,670 | £156,037 | £251,226 | 0.7% | 86.4% |
|---|---|---|---|---|---|---|---|---|
| City of Westminster | 1,584 | £805,000 | £30,250 | £112,790 | £111,879 | £186,729 | 1.4% | 80.6% |
| Camden | 1,465 | £750,000 | £27,500 | £75,738 | £74,614 | £133,263 | 1.3% | 76.2% |
| Hammersmith and Fulham | 1,562 | £675,000 | £23,750 | £50,822 | £49,472 | £96,819 | 2.4% | 71.1% |
| Richmond upon Thames | 2,202 | £710,000 | £25,500 | £48,463 | £47,180 | £93,918 | 0.9% | 73.1% |
| Elmbridge | 1,720 | £657,500 | £22,875 | £47,749 | £46,296 | £91,700 | 4.2% | 66.9% |
| Islington | 1,566 | £645,000 | £22,250 | £42,536 | £41,101 | £84,445 | 1.4% | 70.1% |
| City of London | 112 | £745,000 | £27,250 | £41,914 | £40,842 | £85,287 | 0.0% | 78.6% |
| Wandsworth | 3,854 | £635,000 | £21,750 | £39,906 | £38,330 | £80,341 | 3.2% | 65.6% |
| Merton | 1,805 | £540,000 | £17,000 | £35,663 | £33,609 | £72,308 | 3.9% | 55.2% |
| Barnet | 2,600 | £590,000 | £19,500 | £35,096 | £33,296 | £72,107 | 4.2% | 59.7% |
| Haringey | 1,749 | £580,000 | £19,000 | £34,070 | £32,234 | £70,709 | 3.0% | 60.4% |
| St Albans | 1,749 | £620,000 | £21,000 | £32,279 | £30,789 | £68,611 | 5.3% | 65.4% |
| Hackney | 1,715 | £589,950 | £19,498 | £30,910 | £29,199 | £66,501 | 3.0% | 63.1% |
| Waverley | 1,690 | £540,000 | £17,000 | £30,812 | £28,925 | £64,856 | 8.3% | 54.8% |
| Southwark | 2,337 | £535,000 | £16,750 | £30,399 | £28,270 | £64,841 | 3.0% | 54.2% |
| Brent | 1,442 | £550,000 | £17,500 | £29,114 | £27,179 | £62,400 | 4.4% | 56.4% |
| Three Rivers | 940 | £562,916 | £18,146 | £28,326 | £26,466 | £61,821 | 4.9% | 58.5% |
| Windsor and Maidenhead | 1,625 | £530,000 | £16,500 | £27,431 | £25,444 | £59,938 | 7.0% | 54.0% |
| Lambeth | 2,884 | £540,000 | £17,000 | £27,114 | £24,975 | £59,871 | 2.4% | 54.8% |
| Sevenoaks | 1,395 | £490,000 | £14,500 | £26,977 | £24,692 | £58,695 | 6.0% | 48.0% |
| Ealing | 2,158 | £530,000 | £16,500 | £26,627 | £24,671 | £58,829 | 6.1% | 54.8% |
| Mole Valley | 981 | £580,000 | £19,000 | £26,329 | £24,635 | £58,838 | 8.0% | 58.4% |
| Kingston upon Thames | 1,591 | £560,000 | £18,000 | £26,003 | £23,966 | £58,633 | 3.5% | 55.7% |
| Hertsmere | 1,054 | £550,000 | £17,500 | £25,464 | £23,529 | £56,953 | 5.0% | 55.9% |
| Hounslow | 1,672 | £480,000 | £14,000 | £24,922 | £22,459 | £54,919 | 6.9% | 43.8% |
| Guildford | 1,669 | £495,000 | £14,750 | £24,735 | £22,529 | £55,381 | 8.4% | 48.1% |
| Brentwood | 1,100 | £500,000 | £15,000 | £24,484 | £22,344 | £55,076 | 7.1% | 49.9% |
| Oxford | 1,208 | £452,000 | £12,600 | £23,924 | £21,191 | £53,387 | 6.7% | 39.2% |
| Cotswold | 1,260 | £440,000 | £12,000 | £23,689 | £21,225 | £52,593 | 10.7% | 40.5% |
| Tandridge | 1,003 | £495,000 | £14,750 | £23,067 | £20,865 | £52,855 | 6.9% | 48.7% |
| Epping Forest | 1,453 | £517,000 | £15,850 | £23,034 | £20,931 | £53,406 | 6.1% | 52.6% |
| Cambridge | 1,065 | £481,000 | £14,050 | £22,263 | £19,891 | £51,227 | 7.6% | 45.8% |
| Runnymede | 996 | £468,000 | £13,400 | £22,163 | £19,745 | £49,972 | 12.0% | 41.0% |
| Bromley | 3,636 | £520,000 | £16,000 | £21,535 | £19,427 | £50,921 | 4.8% | 52.6% |
| Epsom and Ewell | 880 | £565,000 | £18,250 | £21,450 | £19,601 | £51,225 | 6.1% | 57.4% |
| Buckinghamshire | 6,325 | £465,000 | £13,250 | £21,349 | £19,001 | £49,570 | 10.5% | 43.5% |
| Winchester | 1,643 | £462,000 | £13,100 | £21,173 | £18,758 | £49,323 | 9.0% | 43.2% |
| Tunbridge Wells | 1,398 | £440,000 | £12,000 | £20,617 | £18,227 | £48,336 | 12.4% | 41.2% |
| Harrow | 1,286 | £555,000 | £17,750 | £20,554 | £18,842 | £49,474 | 6.8% | 58.9% |
| Redbridge | 1,818 | £520,000 | £16,000 | £20,327 | £18,326 | £48,718 | 7.2% | 52.5% |
| South Oxfordshire | 1,752 | £450,000 | £12,500 | £20,077 | £17,406 | £47,720 | 7.7% | 39.8% |
| Reigate and Banstead | 1,819 | £480,000 | £14,000 | £20,037 | £17,844 | £47,782 | 11.0% | 45.1% |
| Waltham Forest | 2,296 | £548,000 | £17,400 | £19,934 | £18,036 | £49,144 | 3.1% | 58.5% |
| Dacorum | 1,768 | £450,000 | £12,500 | £19,775 | £17,234 | £47,164 | 10.5% | 40.2% |
| Chichester | 1,529 | £432,000 | £11,600 | £19,239 | £16,708 | £45,557 | 10.9% | 38.1% |
| Woking | 1,260 | £450,000 | £12,500 | £19,211 | £16,761 | £46,065 | 12.6% | 40.2% |
| Enfield | 1,968 | £472,500 | £13,625 | £19,082 | £16,612 | £46,265 | 7.7% | 43.3% |
| Tower Hamlets | 2,026 | £469,500 | £13,475 | £18,906 | £16,229 | £46,070 | 4.1% | 41.6% |
| Lewisham | 2,476 | £470,000 | £13,500 | £18,773 | £16,240 | £46,153 | 6.2% | 43.5% |
| Hillingdon | 2,030 | £514,000 | £15,700 | £18,654 | £16,655 | £45,867 | 8.2% | 52.3% |
| Surrey Heath | 1,172 | £490,000 | £14,500 | £18,651 | £16,497 | £45,684 | 11.7% | 46.6% |
| Wokingham | 2,130 | £480,000 | £14,000 | £18,325 | £15,945 | £45,043 | 8.5% | 44.7% |
| East Hampshire | 1,677 | £425,000 | £11,250 | £18,031 | £15,444 | £43,708 | 12.3% | 36.4% |
| Uttlesford | 1,189 | £460,000 | £13,000 | £17,958 | £15,388 | £44,418 | 8.5% | 41.5% |
| Welwyn Hatfield | 1,068 | £431,000 | £11,550 | £17,606 | £14,998 | £43,135 | 12.5% | 36.3% |
| East Hertfordshire | 1,934 | £450,000 | £12,500 | £17,411 | £14,850 | £43,195 | 10.2% | 39.3% |
| Greenwich | 2,103 | £455,000 | £12,750 | £17,214 | £14,426 | £42,878 | 6.6% | 37.3% |
| West Oxfordshire | 1,398 | £395,000 | £9,750 | £17,001 | £14,120 | £41,368 | 12.2% | 31.1% |
| South Cambridgeshire | 1,779 | £428,000 | £11,400 | £16,651 | £13,887 | £41,656 | 8.4% | 35.8% |
| Sutton | 1,936 | £457,500 | £12,875 | £16,633 | £14,111 | £41,746 | 9.6% | 40.3% |
| Brighton and Hove | 3,206 | £425,000 | £11,250 | £16,233 | £13,553 | £40,928 | 13.0% | 35.0% |
| Bracknell Forest | 1,508 | £416,000 | £10,800 | £16,213 | £13,359 | £40,245 | 11.6% | 32.2% |
| Bath and North East Somerset | 2,315 | £395,000 | £9,750 | £16,174 | £13,302 | £40,394 | 12.4% | 30.8% |
| Mid Sussex | 2,090 | £440,000 | £12,000 | £16,010 | £13,405 | £40,701 | 12.1% | 36.9% |
| North Hertfordshire | 1,648 | £422,000 | £11,100 | £15,893 | £13,414 | £40,171 | 15.6% | 35.9% |
| Hart | 1,344 | £450,000 | £12,500 | £15,867 | £13,396 | £40,771 | 11.5% | 39.8% |
| Horsham | 1,985 | £434,500 | £11,725 | £15,649 | £12,948 | £40,039 | 12.4% | 34.6% |
| Trafford | 2,693 | £380,000 | £9,000 | £14,676 | £11,825 | £37,377 | 15.9% | 27.0% |
| New Forest | 2,383 | £386,500 | £9,325 | £14,565 | £11,777 | £37,719 | 12.5% | 30.8% |
| Havering | 2,688 | £455,000 | £12,750 | £14,510 | £11,606 | £38,455 | 7.9% | 34.1% |
| Spelthorne | 1,091 | £465,000 | £13,250 | £14,449 | £11,724 | £38,463 | 9.4% | 36.9% |
| Stratford-on-Avon | 1,991 | £368,000 | £8,400 | £14,260 | £11,401 | £36,659 | 15.9% | 26.8% |
| Watford | 848 | £420,000 | £11,000 | £14,123 | £11,375 | £37,378 | 13.4% | 32.0% |
| Tonbridge and Malling | 1,672 | £410,000 | £10,500 | £14,050 | £11,009 | £37,094 | 11.4% | 27.9% |
| West Berkshire | 1,968 | £390,000 | £9,500 | £14,004 | £11,104 | £36,580 | 16.5% | 27.2% |
| Chelmsford | 2,224 | £405,000 | £10,250 | £13,751 | £10,876 | £36,382 | 15.0% | 29.0% |
| Croydon | 3,204 | £430,000 | £11,500 | £13,711 | £10,974 | £36,789 | 12.2% | 34.0% |
| Vale of White Horse | 1,725 | £390,000 | £9,500 | £13,524 | £10,534 | £35,993 | 12.8% | 28.0% |
| Broxbourne | 1,088 | £425,000 | £11,250 | £13,503 | £10,512 | £36,257 | 14.2% | 28.0% |
| Cheltenham | 1,742 | £330,000 | £6,500 | £13,472 | £10,866 | £34,841 | 23.6% | 24.6% |
| Wealden | 2,217 | £375,000 | £8,750 | £13,412 | £10,384 | £35,595 | 12.0% | 25.9% |
| Maldon | 891 | £385,000 | £9,250 | £13,319 | £10,243 | £35,618 | 10.8% | 28.4% |
| Newham | 1,442 | £435,000 | £11,750 | £12,947 | £9,774 | £35,601 | 8.0% | 28.8% |
| South Hams | 1,293 | £353,000 | £7,650 | £12,811 | £10,047 | £34,158 | 20.6% | 25.5% |
| Lewes | 1,397 | £385,000 | £9,250 | £12,726 | £9,681 | £34,690 | 12.7% | 26.2% |
| Bexley | 2,328 | £430,000 | £11,500 | £12,654 | £9,638 | £34,963 | 9.4% | 30.3% |
| Basingstoke and Deane | 2,274 | £375,000 | £8,750 | £12,539 | £9,497 | £33,912 | 14.6% | 24.8% |
| Test Valley | 1,669 | £360,000 | £8,000 | £12,177 | £9,213 | £33,219 | 16.7% | 24.2% |
| Rochford | 1,162 | £405,000 | £10,250 | £11,934 | £8,509 | £33,535 | 7.4% | 23.9% |
| Rother | 1,249 | £355,000 | £7,750 | £11,737 | £8,944 | £32,409 | 19.5% | 24.9% |
| Rutland | 576 | £335,000 | £6,750 | £11,544 | £8,804 | £31,866 | 25.3% | 22.9% |
| Stroud | 1,573 | £340,000 | £7,000 | £11,345 | £8,417 | £31,493 | 20.0% | 21.5% |
| Warwick | 2,048 | £350,000 | £7,500 | £11,257 | £8,219 | £31,546 | 19.2% | 21.0% |
| Adur | 793 | £381,000 | £9,050 | £11,157 | £7,759 | £31,937 | 11.9% | 21.2% |
| Bournemouth, Christchurch and Poole | 5,182 | £335,000 | £6,750 | £11,128 | £8,201 | £30,820 | 22.6% | 19.5% |
| City of Bristol | 5,440 | £351,000 | £7,550 | £10,994 | £7,751 | £31,163 | 17.0% | 19.0% |
| Cherwell | 1,943 | £350,000 | £7,500 | £10,964 | £7,742 | £30,966 | 16.6% | 19.4% |
| Basildon | 2,191 | £360,000 | £8,000 | £10,926 | £7,544 | £31,205 | 14.0% | 19.2% |
| Solihull | 2,550 | £337,500 | £6,875 | £10,904 | £8,240 | £30,664 | 24.3% | 22.9% |
| Maidstone | 2,145 | £365,000 | £8,250 | £10,745 | £7,582 | £30,765 | 14.3% | 20.9% |
| Slough | 771 | £397,500 | £9,875 | £10,419 | £7,355 | £30,445 | 18.8% | 21.7% |
| Bromsgrove | 1,167 | £337,500 | £6,875 | £10,336 | £7,432 | £29,791 | 21.9% | 20.5% |
| Ashford | 1,651 | £345,000 | £7,250 | £10,327 | £7,200 | £30,030 | 17.2% | 20.1% |
| Rushcliffe | 1,751 | £330,000 | £6,500 | £10,317 | £7,349 | £29,724 | 22.4% | 19.5% |
| Dartford | 1,333 | £375,000 | £8,750 | £10,149 | £6,757 | £29,823 | 14.2% | 17.8% |
| Southend-on-Sea | 2,162 | £350,000 | £7,500 | £10,133 | £7,125 | £29,475 | 20.6% | 19.7% |
| East Devon | 2,211 | £325,000 | £6,250 | £10,130 | £7,330 | £29,318 | 22.7% | 20.3% |
| Central Bedfordshire | 4,088 | £365,000 | £8,250 | £10,071 | £6,754 | £29,607 | 14.6% | 18.6% |
| Castle Point | 1,096 | £370,000 | £8,500 | £10,050 | £6,315 | £29,802 | 10.1% | 16.0% |
| Gravesham | 996 | £367,500 | £8,375 | £10,035 | £6,510 | £29,629 | 13.0% | 16.9% |
| Cheshire East | 5,921 | £299,950 | £4,998 | £10,012 | £7,546 | £28,302 | 32.2% | 18.1% |
| Harborough | 1,407 | £325,000 | £6,250 | £9,924 | £6,864 | £29,113 | 21.4% | 18.3% |
| Lichfield | 1,428 | £310,000 | £5,500 | £9,902 | £7,155 | £28,585 | 27.7% | 18.3% |
| Malvern Hills | 1,043 | £337,500 | £6,875 | £9,893 | £6,973 | £29,222 | 20.1% | 21.7% |
| Dorset | 5,406 | £340,000 | £7,000 | £9,878 | £6,974 | £28,938 | 22.2% | 19.6% |
| Fareham | 1,669 | £345,000 | £7,250 | £9,868 | £6,568 | £29,134 | 14.1% | 18.3% |
| Arun | 2,412 | £340,000 | £7,000 | £9,867 | £6,801 | £28,916 | 17.5% | 18.2% |
| Derbyshire Dales | 911 | £320,000 | £6,000 | £9,854 | £7,173 | £28,893 | 29.6% | 20.6% |
| Bedford | 1,944 | £350,000 | £7,500 | £9,793 | £6,479 | £29,010 | 16.9% | 17.1% |
| The Vale of GlamorganWales | 1,787 | £290,000 | £3,900 | £9,766 | £9,766 | £27,553 | n/a | n/a |
| Wychavon | 1,582 | £331,000 | £6,550 | £9,684 | £6,753 | £28,665 | 23.6% | 19.3% |
| Tewkesbury | 1,408 | £325,000 | £6,250 | £9,602 | £6,651 | £28,309 | 22.4% | 18.5% |
| Canterbury | 1,818 | £345,000 | £7,250 | £9,591 | £6,306 | £28,589 | 17.8% | 16.3% |
| East Cambridgeshire | 1,025 | £339,000 | £6,950 | £9,585 | £6,461 | £28,636 | 19.4% | 19.0% |
| Wiltshire | 6,540 | £325,000 | £6,250 | £9,527 | £6,632 | £28,127 | 24.1% | 17.9% |
| Babergh | 1,256 | £325,000 | £6,250 | £9,520 | £6,415 | £28,336 | 22.1% | 17.1% |
| MonmouthshireWales | 1,173 | £325,000 | £6,000 | £9,453 | £9,453 | £27,789 | n/a | n/a |
| Reading | 1,699 | £346,000 | £7,300 | £9,393 | £6,140 | £28,241 | 20.0% | 16.5% |
| Braintree | 2,065 | £340,000 | £7,000 | £9,173 | £5,886 | £27,782 | 17.8% | 16.2% |
| Milton Keynes | 2,974 | £340,000 | £7,000 | £9,100 | £6,093 | £27,435 | 17.9% | 17.4% |
| Rushmoor | 1,134 | £370,000 | £8,500 | £9,098 | £5,802 | £27,729 | 19.4% | 15.6% |
| Barking and Dagenham | 1,115 | £385,000 | £9,250 | £9,090 | £5,155 | £27,908 | 14.0% | 8.3% |
| Isles of Scilly * | 16 | £350,000 | £7,500 | £9,080 | £6,708 | £28,028 | 25.0% | 31.3% |
| Eastleigh | 1,912 | £345,000 | £7,250 | £9,065 | £5,739 | £27,651 | 18.3% | 15.6% |
| North Somerset | 3,189 | £320,000 | £6,000 | £9,043 | £6,079 | £27,254 | 24.0% | 16.3% |
| Worthing | 1,410 | £342,500 | £7,125 | £8,953 | £5,951 | £27,308 | 22.5% | 17.4% |
| Stockport | 3,906 | £310,000 | £5,500 | £8,800 | £5,915 | £26,804 | 27.8% | 16.5% |
| South Gloucestershire | 3,690 | £340,000 | £7,000 | £8,782 | £5,289 | £27,137 | 15.7% | 14.1% |
| Havant | 1,537 | £325,000 | £6,250 | £8,631 | £5,427 | £26,465 | 19.3% | 13.8% |
| Thurrock | 1,749 | £358,000 | £7,900 | £8,606 | £4,887 | £26,851 | 17.8% | 10.3% |
| Exeter | 1,356 | £300,000 | £5,000 | £8,600 | £5,586 | £26,120 | 27.2% | 13.1% |
| Mid Suffolk | 1,516 | £308,000 | £5,400 | £8,459 | £5,437 | £26,236 | 25.7% | 14.3% |
| Folkestone and Hythe | 1,496 | £320,000 | £6,000 | £8,389 | £5,268 | £26,017 | 21.9% | 13.4% |
| York | 2,348 | £302,500 | £5,125 | £8,326 | £5,190 | £25,800 | 29.3% | 12.3% |
| Crawley | 1,014 | £350,000 | £7,500 | £8,295 | £4,636 | £26,263 | 18.6% | 10.7% |
| East Suffolk | 3,345 | £285,000 | £4,250 | £8,251 | £5,492 | £25,047 | 35.1% | 12.2% |
| Colchester | 2,457 | £325,000 | £6,250 | £8,235 | £4,977 | £25,820 | 22.9% | 12.7% |
| Stevenage | 820 | £349,979 | £7,499 | £8,204 | £4,408 | £26,098 | 14.9% | 10.5% |
| Huntingdonshire | 2,450 | £320,000 | £6,000 | £8,116 | £4,959 | £25,577 | 24.8% | 12.8% |
| West Devon | 765 | £295,000 | £4,750 | £8,097 | £5,427 | £25,344 | 32.4% | 15.8% |
| Harlow | 929 | £340,000 | £7,000 | £8,035 | £4,329 | £25,717 | 18.4% | 10.0% |
| North Norfolk | 1,456 | £300,000 | £5,000 | £8,016 | £5,277 | £25,098 | 31.7% | 14.8% |
| Cornwall | 7,320 | £285,000 | £4,250 | £7,933 | £5,234 | £24,629 | 33.6% | 13.1% |
| North Yorkshire | 8,762 | £270,000 | £3,500 | £7,872 | £5,414 | £24,293 | 38.4% | 13.4% |
| West Northamptonshire | 5,274 | £295,000 | £4,750 | £7,704 | £4,714 | £24,512 | 30.4% | 11.7% |
| Teignbridge | 1,871 | £295,000 | £4,750 | £7,634 | £4,821 | £24,318 | 32.3% | 13.0% |
| Norwich | 1,638 | £235,000 | £2,200 | £7,462 | £5,256 | £22,105 | 53.5% | 7.2% |
| CardiffWales | 3,922 | £270,000 | £2,700 | £7,417 | £7,417 | £23,402 | n/a | n/a |
| Herefordshire | 2,276 | £290,000 | £4,500 | £7,409 | £4,644 | £24,007 | 31.3% | 13.5% |
| Dover | 1,506 | £290,000 | £4,500 | £7,283 | £4,343 | £23,718 | 31.8% | 11.1% |
| South Staffordshire | 1,297 | £290,000 | £4,500 | £7,274 | £4,258 | £23,906 | 30.0% | 11.3% |
| South Norfolk | 1,985 | £300,000 | £5,000 | £7,214 | £4,078 | £23,880 | 28.0% | 11.1% |
| Broadland | 1,930 | £310,000 | £5,500 | £7,174 | £3,733 | £23,842 | 24.8% | 8.3% |
| Medway | 3,086 | £312,000 | £5,600 | £7,131 | £3,657 | £23,855 | 21.9% | 9.2% |
| Somerset | 7,560 | £282,500 | £4,125 | £7,122 | £4,325 | £23,373 | 34.0% | 11.7% |
| Mid Devon | 942 | £280,000 | £4,000 | £7,107 | £4,321 | £23,283 | 35.7% | 11.8% |
| Thanet | 1,831 | £295,000 | £4,750 | £7,107 | £4,129 | £23,417 | 29.2% | 11.1% |
| West Suffolk | 2,309 | £287,000 | £4,350 | £7,094 | £4,098 | £23,480 | 32.8% | 10.5% |
| Ribble Valley | 920 | £270,000 | £3,500 | £7,059 | £4,546 | £23,006 | 41.3% | 12.3% |
| Swale | 1,902 | £305,000 | £5,250 | £7,026 | £3,702 | £23,533 | 25.9% | 9.2% |
| Cheshire West and Chester | 4,702 | £266,500 | £3,325 | £6,903 | £4,416 | £22,512 | 38.5% | 11.7% |
| Shropshire | 4,087 | £278,000 | £3,900 | £6,883 | £4,180 | £22,839 | 36.9% | 11.5% |
| Warrington | 2,621 | £265,000 | £3,250 | £6,812 | £4,306 | £22,382 | 39.2% | 11.1% |
| Rugby | 1,422 | £282,500 | £4,125 | £6,804 | £4,004 | £22,805 | 34.6% | 11.0% |
| South Kesteven | 1,961 | £265,000 | £3,250 | £6,711 | £4,045 | £22,109 | 39.0% | 9.1% |
| North Devon | 1,311 | £290,000 | £4,500 | £6,654 | £3,682 | £22,446 | 34.8% | 8.7% |
| Melton | 751 | £269,000 | £3,450 | £6,622 | £4,006 | £22,427 | 41.1% | 11.7% |
| Forest of Dean | 981 | £280,000 | £4,000 | £6,490 | £3,630 | £22,264 | 37.2% | 10.1% |
| Charnwood | 2,210 | £275,000 | £3,750 | £6,436 | £3,595 | £21,995 | 36.6% | 9.4% |
| Luton | 1,489 | £317,500 | £5,875 | £6,411 | £2,683 | £22,338 | 20.0% | 4.2% |
| King's Lynn and West Norfolk | 1,976 | £270,000 | £3,500 | £6,336 | £3,587 | £21,574 | 38.2% | 8.8% |
| Amber Valley | 1,752 | £227,000 | £2,040 | £6,228 | £4,019 | £20,312 | 50.7% | 6.9% |
| Hastings | 1,120 | £280,000 | £4,000 | £6,190 | £3,268 | £21,441 | 32.1% | 7.5% |
| Tendring | 2,255 | £275,000 | £3,750 | £6,100 | £3,179 | £21,212 | 34.8% | 6.8% |
| Portsmouth | 2,170 | £260,000 | £3,000 | £6,049 | £3,192 | £20,595 | 41.6% | 4.8% |
| West Lancashire | 1,403 | £250,000 | £2,500 | £6,045 | £3,727 | £20,710 | 41.1% | 10.3% |
| Eastbourne | 1,337 | £275,000 | £3,750 | £6,013 | £3,162 | £21,075 | 35.1% | 7.7% |
| Leeds | 8,649 | £250,000 | £2,500 | £5,970 | £3,597 | £20,566 | 44.4% | 9.3% |
| Manchester | 4,196 | £260,000 | £3,000 | £5,899 | £3,303 | £20,762 | 42.6% | 8.7% |
| Blaby | 1,256 | £283,000 | £4,150 | £5,877 | £2,582 | £21,255 | 29.8% | 5.8% |
| Breckland | 1,874 | £265,000 | £3,250 | £5,863 | £3,092 | £20,880 | 41.1% | 8.1% |
| North Northamptonshire | 4,552 | £260,000 | £3,000 | £5,835 | £3,071 | £20,446 | 42.8% | 6.0% |
| High Peak | 1,226 | £265,000 | £3,250 | £5,825 | £3,054 | £20,862 | 41.4% | 8.2% |
| Torridge | 895 | £270,000 | £3,500 | £5,817 | £3,069 | £20,764 | 41.2% | 8.2% |
| North West Leicestershire | 1,541 | £270,000 | £3,500 | £5,780 | £2,924 | £20,797 | 40.2% | 7.5% |
| Hinckley and Bosworth | 1,626 | £263,000 | £3,150 | £5,638 | £2,850 | £20,434 | 41.1% | 7.3% |
| Oadby and Wigston | 569 | £275,000 | £3,750 | £5,613 | £2,453 | £20,593 | 33.7% | 4.9% |
| Swindon | 2,867 | £277,000 | £3,850 | £5,574 | £2,553 | £20,375 | 35.7% | 5.9% |
| Isle of Wight | 1,927 | £258,500 | £2,925 | £5,566 | £3,007 | £19,989 | 39.6% | 8.1% |
| Fylde | 1,300 | £243,000 | £2,360 | £5,529 | £3,141 | £19,550 | 43.2% | 7.1% |
| Stafford | 1,750 | £258,000 | £2,900 | £5,470 | £2,815 | £19,979 | 41.7% | 7.2% |
| North East Derbyshire | 1,253 | £247,500 | £2,450 | £5,437 | £2,983 | £19,560 | 44.9% | 7.1% |
| Newark and Sherwood | 1,682 | £240,000 | £2,300 | £5,426 | £3,103 | £19,582 | 48.6% | 8.3% |
| North Warwickshire | 836 | £265,000 | £3,250 | £5,387 | £2,673 | £19,845 | 43.9% | 6.9% |
| Northumberland | 4,385 | £210,000 | £1,700 | £5,379 | £3,524 | £18,592 | 42.8% | 9.1% |
| East Staffordshire | 1,586 | £240,000 | £2,300 | £5,363 | £3,063 | £19,339 | 43.2% | 8.5% |
| Westmorland and Furness | 3,182 | £240,000 | £2,300 | £5,275 | £3,051 | £18,980 | 40.7% | 8.3% |
| Birmingham | 7,873 | £240,000 | £2,300 | £5,205 | £2,820 | £19,083 | 47.2% | 7.0% |
| Torbay | 1,868 | £245,000 | £2,400 | £5,121 | £2,678 | £18,941 | 42.0% | 6.8% |
| South Derbyshire | 1,665 | £250,000 | £2,500 | £5,013 | £2,348 | £19,047 | 47.3% | 5.4% |
| Broxtowe | 1,414 | £254,000 | £2,700 | £5,009 | £2,241 | £19,143 | 46.4% | 5.1% |
| Wyre Forest | 1,294 | £252,500 | £2,625 | £4,987 | £2,351 | £18,930 | 43.7% | 5.6% |
| Gedling | 1,497 | £250,000 | £2,500 | £4,954 | £2,285 | £18,926 | 47.6% | 5.0% |
| Wirral | 4,011 | £230,000 | £2,100 | £4,943 | £2,785 | £18,284 | 45.8% | 7.4% |
| Worcester | 1,268 | £255,000 | £2,750 | £4,900 | £2,169 | £18,895 | 42.4% | 5.2% |
| Gosport | 1,062 | £257,000 | £2,850 | £4,875 | £2,233 | £18,784 | 40.2% | 6.4% |
| PowysWales | 1,253 | £250,000 | £1,500 | £4,874 | £4,874 | £19,018 | n/a | n/a |
| Redditch | 950 | £262,000 | £3,100 | £4,861 | £2,059 | £18,812 | 41.2% | 4.4% |
| City of Peterborough | 1,864 | £244,000 | £2,380 | £4,831 | £2,337 | £18,455 | 47.5% | 5.3% |
| Bury | 2,123 | £247,000 | £2,440 | £4,785 | £2,255 | £18,417 | 46.1% | 5.7% |
| Sheffield | 5,471 | £215,000 | £1,800 | £4,753 | £2,750 | £17,834 | 51.5% | 7.3% |
| Southampton | 2,436 | £260,000 | £3,000 | £4,688 | £1,947 | £18,342 | 38.2% | 4.6% |
| Chorley | 1,490 | £230,000 | £2,100 | £4,686 | £2,397 | £17,981 | 49.3% | 5.7% |
| North Kesteven | 1,755 | £241,000 | £2,320 | £4,660 | £2,121 | £18,303 | 51.2% | 5.1% |
| Newcastle upon Tyne | 2,898 | £205,000 | £1,600 | £4,632 | £2,715 | £17,199 | 49.7% | 6.1% |
| Staffordshire Moorlands | 1,171 | £230,000 | £2,100 | £4,461 | £2,209 | £17,665 | 53.4% | 6.1% |
| Isle of AngleseyWales | 697 | £230,000 | £300 | £4,458 | £4,458 | £17,836 | n/a | n/a |
| Sefton | 3,199 | £230,000 | £2,100 | £4,414 | £2,194 | £17,277 | 46.9% | 5.7% |
| West Lindsey | 1,411 | £230,000 | £2,100 | £4,366 | £2,076 | £17,195 | 44.0% | 5.2% |
| Gloucester | 1,571 | £255,000 | £2,750 | £4,345 | £1,520 | £17,735 | 43.0% | 2.6% |
| Salford | 2,680 | £237,500 | £2,250 | £4,281 | £1,840 | £17,382 | 48.9% | 4.5% |
| City of Plymouth | 3,371 | £227,500 | £2,050 | £4,267 | £1,918 | £16,896 | 52.7% | 2.8% |
| East Riding of Yorkshire | 5,138 | £225,000 | £2,000 | £4,264 | £2,049 | £16,995 | 49.8% | 4.7% |
| Tamworth | 998 | £250,000 | £2,500 | £4,262 | £1,483 | £17,583 | 46.7% | 2.1% |
| North Tyneside | 2,538 | £215,000 | £1,800 | £4,234 | £2,121 | £16,735 | 45.5% | 5.3% |
| NewportWales | 1,867 | £235,000 | £600 | £4,230 | £4,230 | £17,752 | n/a | n/a |
| PembrokeshireWales | 1,461 | £225,000 | £0 | £4,212 | £4,212 | £17,329 | n/a | n/a |
| Dudley | 3,117 | £240,000 | £2,300 | £4,092 | £1,509 | £17,105 | 49.8% | 3.1% |
| Kirklees | 4,823 | £215,000 | £1,800 | £3,998 | £1,961 | £16,314 | 49.5% | 5.1% |
| Leicester | 2,046 | £243,400 | £2,368 | £3,950 | £1,425 | £16,757 | 47.1% | 3.3% |
| South Holland | 1,333 | £235,000 | £2,200 | £3,868 | £1,348 | £16,561 | 50.5% | 2.5% |
| Walsall | 2,284 | £225,000 | £2,000 | £3,830 | £1,538 | £16,316 | 52.8% | 3.6% |
| Wrekin | 1,981 | £230,000 | £2,100 | £3,794 | £1,399 | £16,313 | 51.6% | 2.9% |
| Ipswich | 1,418 | £240,000 | £2,300 | £3,792 | £1,392 | £16,398 | 50.7% | 3.9% |
| Fenland | 1,344 | £230,000 | £2,100 | £3,788 | £1,338 | £16,438 | 54.7% | 2.6% |
| Nuneaton and Bedworth | 1,517 | £236,000 | £2,220 | £3,778 | £1,254 | £16,394 | 51.3% | 2.2% |
| Erewash | 1,459 | £220,000 | £1,900 | £3,766 | £1,636 | £16,154 | 60.0% | 4.0% |
| Coventry | 2,953 | £230,000 | £2,100 | £3,722 | £1,418 | £16,191 | 54.8% | 3.5% |
| Bradford | 5,792 | £190,000 | £1,300 | £3,712 | £1,999 | £15,240 | 50.9% | 4.8% |
| Calderdale | 2,774 | £195,000 | £1,400 | £3,648 | £1,944 | £15,288 | 51.9% | 5.9% |
| Bassetlaw | 1,525 | £210,000 | £1,700 | £3,644 | £1,530 | £15,696 | 53.0% | 3.5% |
| South Ribble | 1,640 | £220,000 | £1,900 | £3,608 | £1,366 | £15,849 | 54.9% | 2.9% |
| ConwyWales | 1,673 | £215,000 | £0 | £3,583 | £3,583 | £16,087 | n/a | n/a |
| Oldham | 2,118 | £215,000 | £1,800 | £3,582 | £1,504 | £15,702 | 58.0% | 3.9% |
| Cannock Chase | 1,220 | £225,000 | £2,000 | £3,580 | £1,223 | £15,958 | 56.1% | 2.6% |
| Liverpool | 3,951 | £190,000 | £1,300 | £3,560 | £1,829 | £15,025 | 51.4% | 5.0% |
| East Lindsey | 1,845 | £215,000 | £1,800 | £3,553 | £1,439 | £15,597 | 53.4% | 3.8% |
| Lancaster | 1,749 | £202,000 | £1,540 | £3,526 | £1,572 | £15,329 | 54.4% | 4.1% |
| SwanseaWales | 2,479 | £200,000 | £0 | £3,526 | £3,526 | £15,692 | n/a | n/a |
| Bolton | 3,010 | £208,000 | £1,660 | £3,503 | £1,538 | £15,310 | 56.0% | 3.7% |
| Rossendale | 961 | £189,950 | £1,299 | £3,470 | £1,618 | £14,929 | 53.1% | 3.1% |
| CeredigionWales | 795 | £235,000 | £600 | £3,446 | £3,446 | £16,499 | n/a | n/a |
| Preston | 1,709 | £200,000 | £1,500 | £3,439 | £1,576 | £14,886 | 47.2% | 4.0% |
| Newcastle-under-Lyme | 1,484 | £205,000 | £1,600 | £3,437 | £1,452 | £15,171 | 54.9% | 3.4% |
| Great Yarmouth | 1,203 | £220,000 | £1,900 | £3,436 | £1,280 | £15,361 | 52.0% | 3.1% |
| City of Derby | 2,772 | £218,000 | £1,860 | £3,425 | £1,245 | £15,401 | 55.5% | 2.8% |
| Rotherham | 2,838 | £195,000 | £1,400 | £3,385 | £1,572 | £14,523 | 57.0% | 2.2% |
| Wolverhampton | 1,892 | £225,000 | £2,000 | £3,309 | £1,073 | £15,298 | 56.1% | 2.5% |
| Rochdale | 2,267 | £211,000 | £1,720 | £3,304 | £1,152 | £15,089 | 56.9% | 2.2% |
| Halton | 1,249 | £195,000 | £1,400 | £3,276 | £1,422 | £14,633 | 52.4% | 3.4% |
| Wakefield | 3,957 | £207,000 | £1,640 | £3,251 | £1,239 | £14,835 | 56.0% | 2.7% |
| BridgendWales | 1,849 | £220,000 | £0 | £3,242 | £3,242 | £15,702 | n/a | n/a |
| Tameside | 2,315 | £218,000 | £1,860 | £3,237 | £1,008 | £15,137 | 60.3% | 1.7% |
| GwyneddWales | 1,299 | £200,000 | £0 | £3,215 | £3,215 | £14,987 | n/a | n/a |
| Wyre | 1,696 | £190,600 | £1,312 | £3,197 | £1,373 | £14,496 | 54.4% | 3.5% |
| WrexhamWales | 1,423 | £201,000 | £0 | £3,110 | £3,110 | £15,159 | n/a | n/a |
| Chesterfield | 1,358 | £198,000 | £1,460 | £3,072 | £1,156 | £14,403 | 57.5% | 2.8% |
| FlintshireWales | 1,840 | £215,000 | £0 | £3,009 | £3,009 | £15,427 | n/a | n/a |
| CarmarthenshireWales | 2,079 | £200,000 | £0 | £2,958 | £2,958 | £14,839 | n/a | n/a |
| Boston | 744 | £205,000 | £1,600 | £2,929 | £971 | £14,170 | 57.3% | 2.3% |
| Stockton-on-Tees | 2,301 | £180,000 | £1,100 | £2,911 | £1,317 | £13,514 | 53.0% | 3.5% |
| City of Nottingham | 2,471 | £200,000 | £1,500 | £2,830 | £972 | £13,960 | 63.8% | 2.4% |
| Wigan | 3,784 | £200,000 | £1,500 | £2,812 | £914 | £13,882 | 59.0% | 1.9% |
| Cumberland | 3,889 | £175,000 | £1,000 | £2,732 | £1,128 | £13,071 | 46.5% | 2.5% |
| DenbighshireWales | 1,211 | £205,000 | £0 | £2,690 | £2,690 | £14,645 | n/a | n/a |
| Sandwell | 2,113 | £222,000 | £1,940 | £2,667 | £467 | £13,968 | 57.6% | 0.5% |
| Mansfield | 1,225 | £194,500 | £1,390 | £2,666 | £818 | £13,372 | 55.3% | 1.2% |
| St Helens | 2,048 | £192,000 | £1,340 | £2,648 | £906 | £13,333 | 57.2% | 1.9% |
| Lincoln | 1,168 | £190,000 | £1,300 | £2,621 | £899 | £13,340 | 63.6% | 1.9% |
| Knowsley | 1,389 | £195,000 | £1,400 | £2,605 | £755 | £13,381 | 58.5% | 1.5% |
| Ashfield | 1,466 | £195,000 | £1,400 | £2,599 | £756 | £13,438 | 62.9% | 1.5% |
| Darlington | 1,433 | £170,000 | £900 | £2,502 | £977 | £12,574 | 48.8% | 2.4% |
| Doncaster | 3,511 | £180,000 | £1,100 | £2,491 | £929 | £12,772 | 57.3% | 2.2% |
| Barnsley | 2,769 | £180,000 | £1,100 | £2,482 | £915 | £12,773 | 57.2% | 2.3% |
| North Lincolnshire | 2,150 | £177,500 | £1,050 | £2,443 | £795 | £12,757 | 57.2% | 1.7% |
| Blackburn With Darwen | 1,511 | £167,500 | £850 | £2,429 | £976 | £12,279 | 48.6% | 1.9% |
| TorfaenWales | 937 | £196,000 | £0 | £2,380 | £2,380 | £13,920 | n/a | n/a |
| Hartlepool | 1,074 | £153,000 | £560 | £2,354 | £1,154 | £11,476 | 44.6% | 2.5% |
| Bolsover | 1,078 | £180,000 | £1,100 | £2,264 | £726 | £12,395 | 60.9% | 1.7% |
| South Tyneside | 1,357 | £168,000 | £860 | £2,187 | £790 | £11,807 | 51.3% | 2.1% |
| Pendle | 1,204 | £152,000 | £540 | £2,080 | £877 | £11,111 | 44.7% | 2.2% |
| CaerphillyWales | 1,884 | £200,000 | £0 | £2,068 | £2,068 | £13,410 | n/a | n/a |
| Gateshead | 2,182 | £162,000 | £740 | £2,068 | £748 | £11,532 | 53.7% | 1.8% |
| County Durham | 6,383 | £144,000 | £380 | £1,902 | £761 | £10,499 | 41.0% | 1.7% |
| North East Lincolnshire | 2,036 | £160,000 | £700 | £1,823 | £576 | £10,788 | 51.5% | 1.3% |
| Redcar and Cleveland | 1,565 | £165,500 | £810 | £1,802 | £464 | £10,920 | 55.7% | 0.6% |
| Sunderland | 2,770 | £153,000 | £560 | £1,755 | £512 | £10,526 | 47.5% | 0.9% |
| Rhondda Cynon TaffWales | 2,617 | £163,000 | £0 | £1,727 | £1,727 | £11,524 | n/a | n/a |
| Middlesbrough | 1,304 | £160,000 | £700 | £1,666 | £458 | £10,349 | 50.8% | 0.8% |
| Burnley | 1,152 | £140,000 | £300 | £1,486 | £379 | £9,591 | 41.5% | 0.4% |
| Stoke-on-Trent | 2,456 | £160,000 | £700 | £1,469 | £289 | £10,212 | 59.3% | 0.5% |
| Neath Port TalbotWales | 1,457 | £165,000 | £0 | £1,225 | £1,225 | £10,685 | n/a | n/a |
| Hyndburn | 984 | £145,000 | £400 | £1,219 | £202 | £9,254 | 47.5% | 0.3% |
| Merthyr TydfilWales | 481 | £145,000 | £0 | £1,086 | £1,086 | £9,810 | n/a | n/a |
| Blackpool | 1,801 | £140,000 | £300 | £963 | £132 | £8,663 | 53.6% | 0.2% |
| Blaenau GwentWales | 630 | £142,000 | £0 | £891 | £891 | £9,422 | n/a | n/a |
| City of Kingston upon Hull | 2,513 | £140,000 | £300 | £882 | £97 | £8,489 | 55.2% | 0.1% |
* Fewer than 100 sales in the period, so treat the figures with caution. The last two columns are England only: Wales has no first-time buyer relief and its nil-rate band did not change in April 2025.
How we worked this out
- Data. HM Land Registry Price Paid Data for England and Wales, standard entries (category A) with a transfer date from August 2025 to July 2026. This leaves out repossessions, sales identified as buy-to-let, sales to companies and other non-standard transfers.
- Calculation. We ran every sale through the same engine as our calculators, at the rates in force for the whole period: SDLT rates from 1 April 2025 in England, and Land Transaction Tax in Wales.
- Buyer type. Land Registry does not record who bought, so each sale is priced three ways: a home mover at standard rates, a first-time buyer assuming they qualify for relief, and an additional-property buyer paying the 5% surcharge (higher rates in Wales). These show what each buyer would pay on the homes that sold, not what buyers actually paid.
- Newly paying since April 2025. Sales above £125,000 and up to £250,000, where a home mover now pays SDLT but paid nothing under the rates from 23 September 2022 to 31 March 2025.
- Areas. The local authority recorded by Land Registry. Rankings include areas with at least 300 sales. Scotland and Northern Ireland are not covered by this dataset.
- Not tax receipts. These figures will not match HMRC's SDLT receipts, which cover England and Northern Ireland, every buyer type and non-residential property. For receipts, see what HMRC's receipts data shows.
- Lag. Sales reach Land Registry weeks after completion, so the most recent months may be slightly incomplete. We refresh the figures each quarter.
Use this data
Journalists, agents and bloggers are welcome to use these figures and charts. Please credit Calculate My Stamp Duty with a link to this page.
Download all 318 areas (CSV)Embed: Home sales newly paying stamp duty since April 2025
<figure><img src="https://calculatemystampduty.co.uk/data/stamp-duty-newly-taxed-since-april-2025.svg" alt="Bar chart: share of home sales newly paying stamp duty since April 2025, highest 12 areas in England, led by City of Nottingham at 63.8%" width="800" loading="lazy"><figcaption>Source: <a href="https://calculatemystampduty.co.uk/resources/stamp-duty-by-local-authority">Calculate My Stamp Duty</a>, analysis of HM Land Registry Price Paid Data.</figcaption></figure>Embed: Where first-time buyer relief runs out
<figure><img src="https://calculatemystampduty.co.uk/data/stamp-duty-first-time-buyer-relief-gap.svg" alt="Bar chart: share of sales above £500,000 where first-time buyers get no relief, highest 12 areas in England, led by Kensington and Chelsea at 86.4%" width="800" loading="lazy"><figcaption>Source: <a href="https://calculatemystampduty.co.uk/resources/stamp-duty-by-local-authority">Calculate My Stamp Duty</a>, analysis of HM Land Registry Price Paid Data.</figcaption></figure>Suggested citation: Calculate My Stamp Duty, Average Stamp Duty by Local Authority, England and Wales, August 2025 to July 2026. Contains HM Land Registry data © Crown copyright and database right 2026. Licensed under the Open Government Licence v3.0.
Not a first or only home?
On the same homes, an additional-property buyer in England would pay £29,268 on average, 2.7 times a home mover's bill. Work out your own figure.
Or use the main stamp duty calculatorReviewed by

Julie White
ACAStamp duty specialist since 1999Stamp Duty Land Tax Specialist
ACA and Tax Adviser with a career spanning nearly four decades, specialising in stamp duty planning and advisory work since 1999.